The United States still spends the most, and reinvests the least.
Absolute dollars flatter a large country. The measure that matters is how much of a farm economy gets put back into the science that keeps it productive. On that one the United States has gone from above average to below it.
Public agricultural research as a share of agricultural GDP
3.5%
United States, mid 2000s peak
Share of agricultural GDP put back into public research, at its highest recorded level.
2.0%
United States, most recent comparable reading
By 2013, below the average for high income economies rather than above it.
4.5%
Northwest Europe and high income Asia
More than twice the American share, and rising since the early 1980s.
Research reaches the field about thirty years after it is paid for.
The largest effects of public agricultural research appear up to three decades after the money is spent, and American funding stopped growing in the early 1980s. So the numbers below are not a verdict on today’s farmers or today’s science. They are the delayed result of budget decisions taken before most of the current Congress was elected, and this decade’s will not show until the 2050s.
2.1%
United States, 1980s
Peak productivity growth, during the worst farm crisis since the Depression.
0.28%
United States, 2014 to 2023
A historical minimum. Growth came from using more inputs, not from using them better.
-0.05%
United States, past decade, international basis
On the measure used to compare countries, productivity did not grow at all.
1.9%
China, same period, same basis
Backed by roughly twice the research funding, arriving on schedule.
Note which decade produced the best result. Productivity grew fastest during the 1980s farm crisis, when credit dried up and operators had to get more out of what they already owned. The cheap money decades went the other way. Capital availability and productivity growth are not the same thing, and confusing them is how a sector spends twenty years feeling prosperous while its research base erodes.
European Union
Rising
EUR 1.25 billion committed for 2026 and 2027
Food, bioeconomy and agriculture research under Horizon Europe, adopted December 2025.
Canada
Rising
A standing national cluster, second funding round
One of five national innovation clusters, on a second round of 150 million Canadian dollars.
Brazil and India
Rising
Decades of sustained public investment
Both raised productivity through long run research funding while American productivity fell.
China
Rising
Roughly fivefold since 2000
Passed the United States in 2011 and is now the largest public funder in the world.
United States
Falling
A third lower than 2002
Peaked at 7.64 billion dollars in 2002. By 2019, the last complete year on record, 5.16 billion in constant dollars.
$234B
Estimated total United States Department of Agriculture outlays for fiscal 2026.
$3.5B
Combined appropriations for the department's two research agencies.
1.5%
About a penny and a half of every dollar the department spends goes to finding out anything it does not already know.
$1,842
Per farm, per year, across the 1,900,487 farms counted in 2022. Below two million for the first time since before the Civil War.
Support renews itself. Research has to win an argument every year.
$39B
a year, automatically
Commodity support, crop insurance and conservation renew through the farm bill baseline. Nobody votes on it annually.
$3.5B
a year, only if appropriated
Research sits outside that baseline. It must be argued for and passed every year, and was proposed for a one third cut this cycle.
That asymmetry is the policy problem in one line, and it has nothing to do with any other country. A programme defended annually always loses to one that is not.
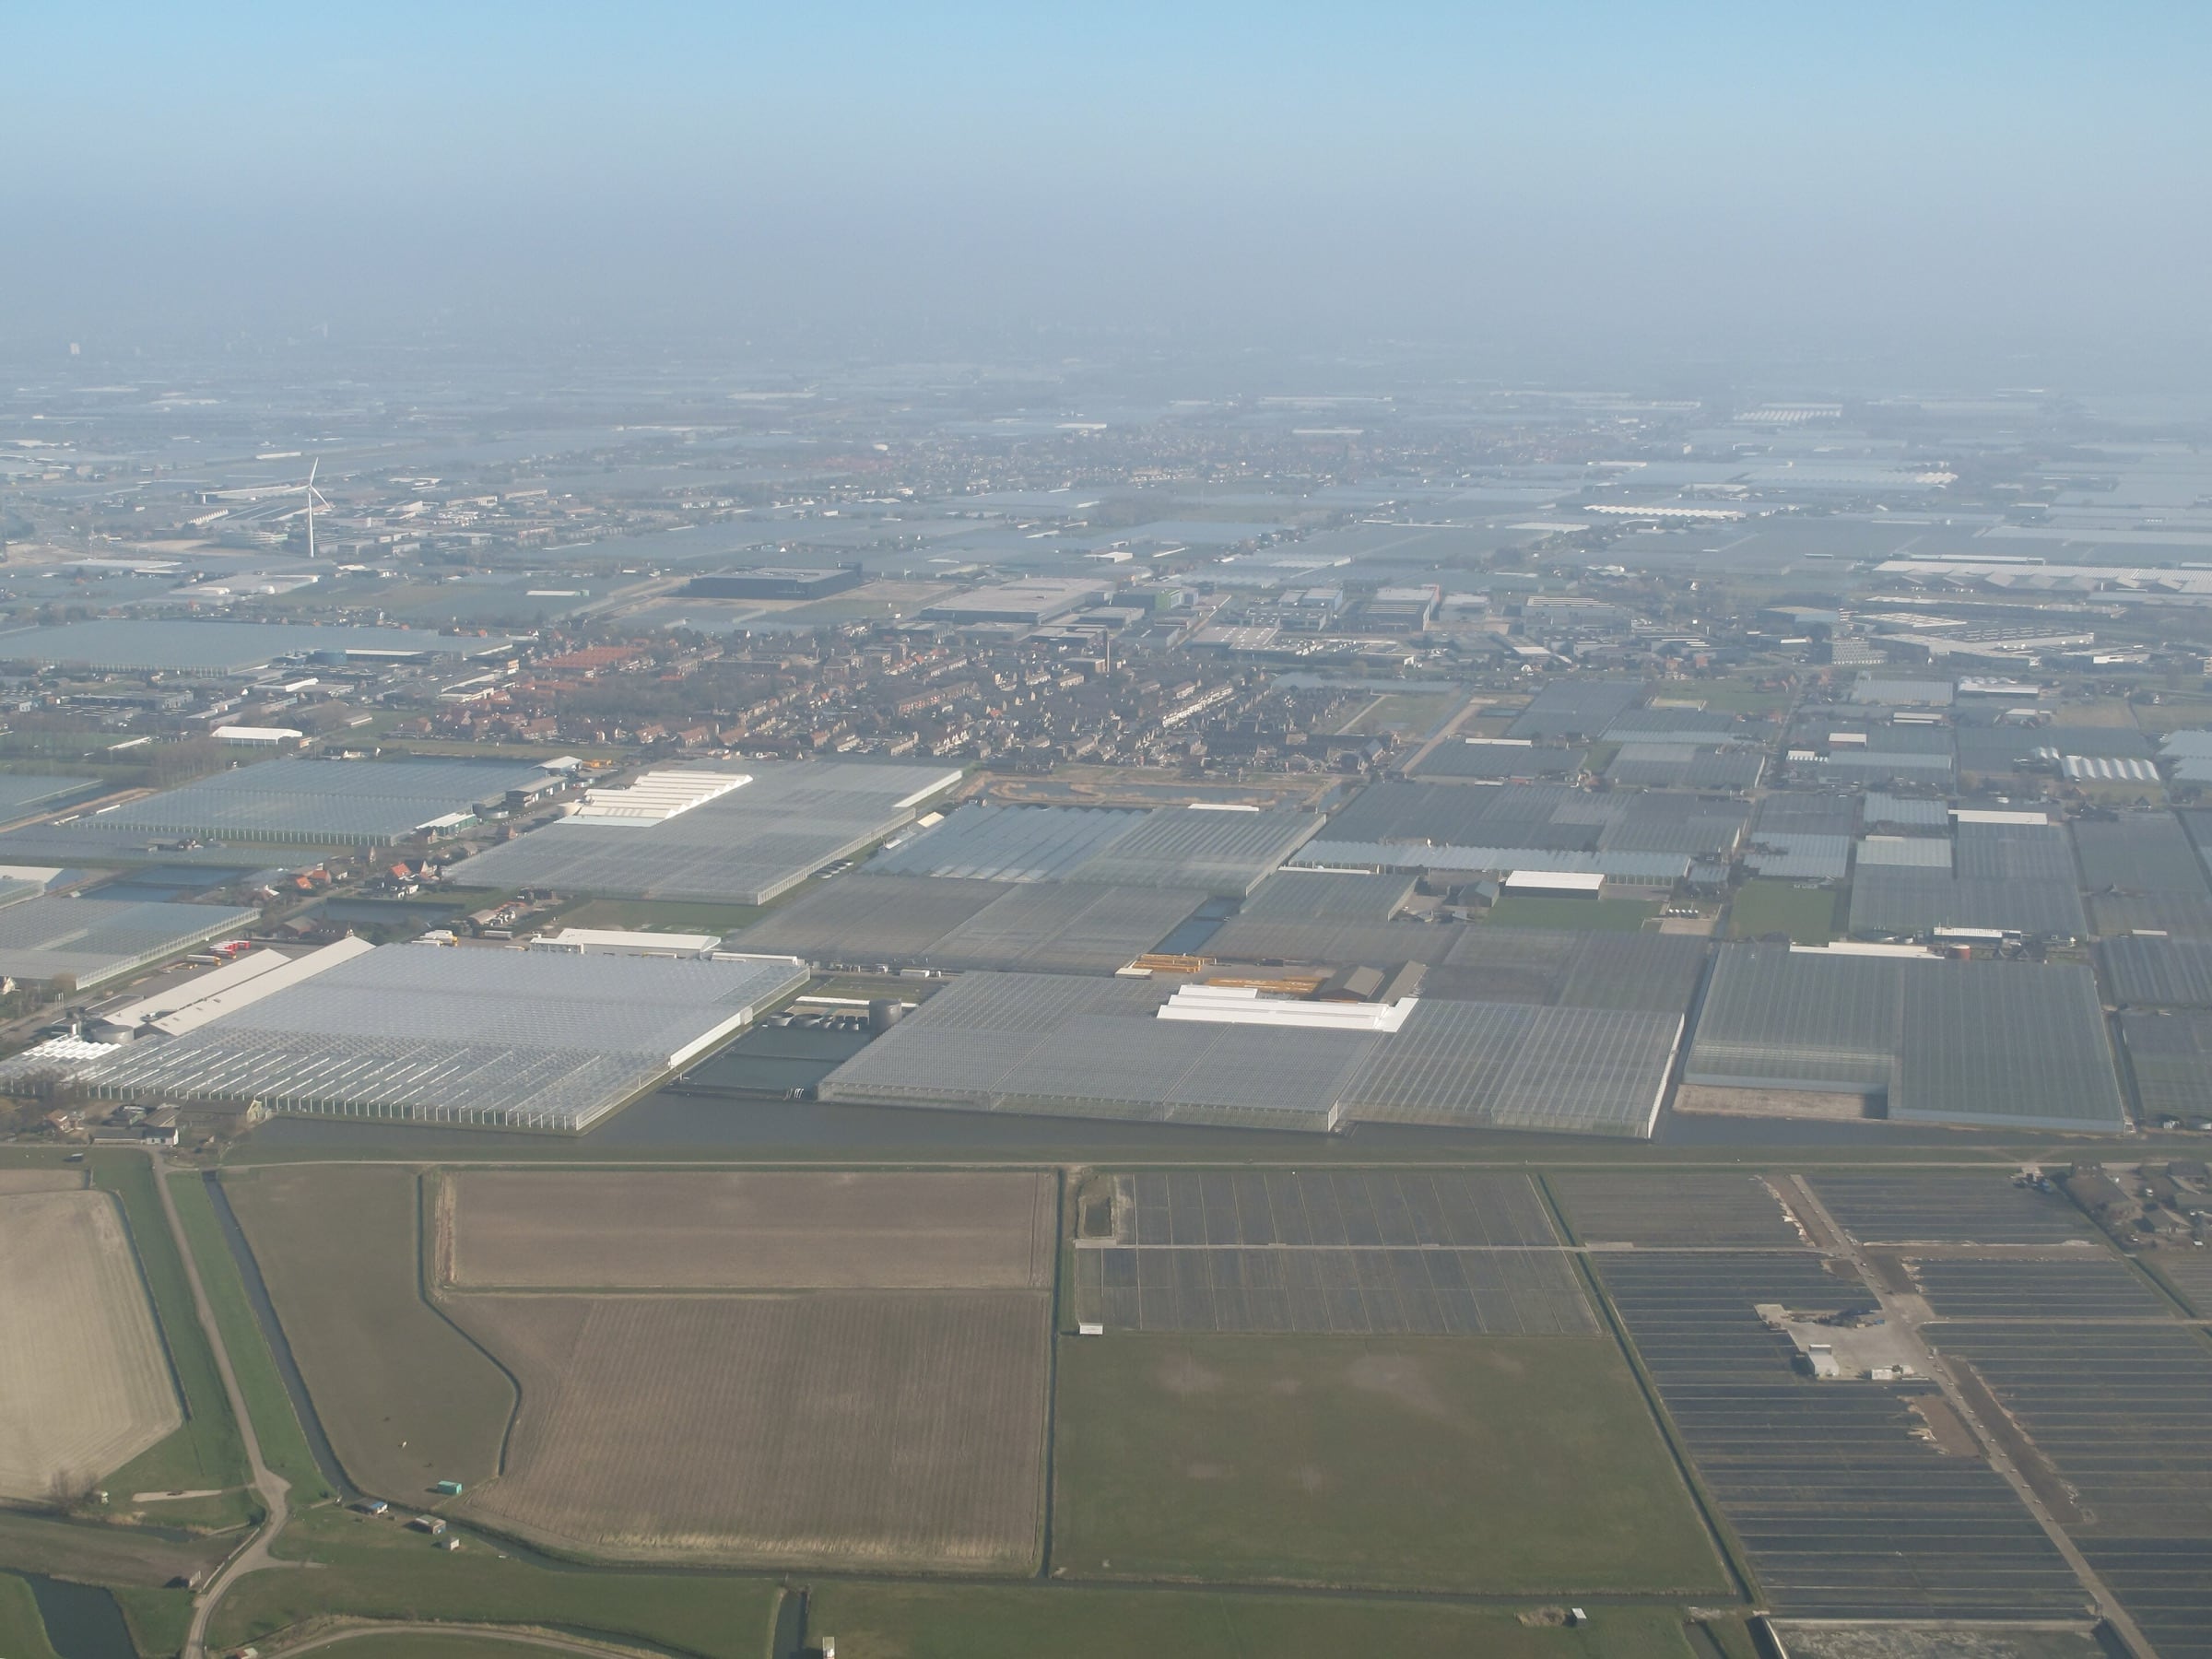
One research university, and fifteen hundred companies inside a twenty kilometre radius.
The Netherlands is roughly the size of Maryland and among the largest agricultural exporters on earth. It did not get there on land. It got there by putting a research university at the centre of a concentrated cluster and leaving it there for decades. This is the model the United States invented and then stopped funding.
$16.2B
Global agrifoodtech funding in 2025, down 3 percent on the year before.
12%
Fall in deal count, even as money into farm technology rose 7 percent.
8%
Decline in United States agrifoodtech funding, in a year it still led the sector.
Both kinds of money are currently pointed the wrong way. See what has actually been delivered.